J Urol Oncol > Volume 22(1); 2024 > Article
Frost, Ziarati, Moen, Kysh, Johnson, Pearce, Daneshmand, Siegmund, and Cortessis: Poorer Outcomes in Bladder Cancer Patients With Diabetes: A Systematic Review and Meta-analysis Addressing Over 226,472 Bladder Cancer Patients

Abstract

Purpose

Diabetes mellitus, a frequent comorbid condition in cancer patients, has been shown to increase risk of all-site cancer mortality. This relationship has not been systematically studied in bladder cancer patients. This systematic review and meta-analysis aimed to identify, evaluate, and synthesize available evidence on the relationship between history of diabetes and outcomes in bladder cancer patients.

Materials and Methods

Systematic searches interrogated OVID MEDLINE, Embase, Web of Science, Google Scholar, and Cochrane Library to identify scholarly reports relating diabetes to all-cause mortality, bladder cancer-specific mortality, recurrence, and progression in bladder cancer patients. After critical review, meta-analysis was used to quantitively synthesize qualifying data and assess potential influence of publication bias, clinical heterogeneity, and residual confounding.

Results

We synthesized data on over 226,472 patients treated with curative intent uniquely represented in 28 studies that met quality metrics. Having diabetes was positively associated with each outcome. Hazard ratio estimates were indistinguishable for mortality from any cause, 1.22 (95% confidence interval [CI], 1.12-1.33) and bladder cancer-specific mortality, 1.28 (95% CI 1.17-1.41) and notably stronger in patients with muscle-invasive and high-risk non-muscle-invasive bladder cancer, 1.32 (95% CI, 1.15-1.50) and 1.48 (95% CI, 1.06-2.06). Neither publication bias, systematic error, nor confounding by factors such as smoking or obesity is likely to explain the observed associations.

Conclusions

Bladder cancer patients with diabetes experience elevated mortality that is not explained by diabetes-related comorbidities or complications. Future research should explore type, severity, and duration of diabetes in relation to unfavorable bladder cancer outcomes.

INTRODUCTION

Bladder cancer is the 10th most common cancer worldwide, and 6th most diagnosed malignancy of men in the United States (US) [1]. The American Cancer Society projected 17,100 deaths from bladder cancer in 2022 in the US alone [2]. Muscle-invasive bladder cancer (MIBC) has a 5-year survival rate of 38% [3] while non-muscle-invasive bladder cancer (NMIBC) has a recurrence rate of up to 87% and progression rate of up to 45% [4]. Bladder cancer is the most expensive cancer to treat, costing about 4 billion dollars per year in the US [5]. Most bladder cancer is diagnosed in adults 65 or older; half of the increase in world population is projected to consist of adults ages 60 or older [6]. This demographic change will increase bladder cancer occurrence, prevalence, and mortality, augmenting financial and clinical burdens.
Diabetes mellitus is a major public health challenge, and prevalence is increasing worldwide [7]. There is abundant evidence that those with diabetes have elevated risks of developing numerous malignancies [8-12], and diabetes is one of the most frequent comorbid conditions in cancer [13].
Diabetic cancer patients reportedly have 20% greater allsite cancer mortality than cancer patients without diabetes [12]. Such differences have not been systematically assessed for cancer at each organ site. Diabetes’ influence on cancer survival remains poorly understood. The elevated mortality could be due entirely to complications of diabetes such as wound infection or cardiac events; conversely, diabetes may influence processes that increase host vulnerability or encourage aggressive behavior of cancer. Goals of this research were to learn whether bladder cancer patients with diabetes have greater mortality than other bladder cancer patients and, should such a difference be evident, to estimate its magnitude and investigate its origins. We reasoned that if excess mortality is due to complications of diabetes, diabetic patients would be found to have greater all-cause mortality than those without diabetes, but similar magnitudes of bladder cancer-specific mortality, recurrence, and progression. Conversely, if diabetes or processes inherent to diabetes contribute to oncogenesis, associations of all-cause mortality and bladder cancer-specific mortality with diabetes would have similar magnitudes.

MATERIALS AND METHODS

1. Protocol and Registration

The study protocol was registered with the International Prospective Register of Systematic Reviews (PROSPERO Identification: CRD42021251175) and is available online. Reporting followed PRISMA (Preferred Reporting Items for Systematic Reviews and Meta-Analyses) 2020 guidelines [14].

2. Eligibility Criteria

Using the PICO (Person, Independent variable, Comparator, Outcome) method to define the research question, we specified person to be humans with bladder cancer, intervention to be diabetes, comparator to be bladder cancer patients without diabetes, and outcomes to be allcause mortality, bladder cancer-specific mortality, bladder cancer recurrence and bladder cancer progression. Studies which reported on original, individual level, human data that assessed bladder cancer outcomes in relation to history of diabetes were included. Reviews and studies of non-human data were excluded. There were no limitations regarding year of publication, geography, language, or length of follow-up.

3. Information Sources

Systematic searches of OVID MEDLINE, Embase, Web of Science, Google Scholar, and Cochrane Library were conducted by professional librarians using controlled vocabulary and keywords. To query the intersection between urinary bladder neoplasms, diabetes mellitus and an extensive set of outcomes, we combined terms for each domain with the Boolean operator ‘OR’ then identified their intersection with ‘AND’ (Supplementary Material). Searches were implemented from inception of each database and repeated upon initial completion of the meta-analysis on May 6, 2021.

4. Study Selection

Deduplicated title and abstract citations were loaded into Covidence software and screened to eliminate clearly ineligible reports by 2 independent investigators, who reviewed full text of remaining reports to identify those satisfying inclusion criteria. Discrepancies were resolved by consensus with occasional adjudication by a third reviewer. For each report meeting inclusion criteria, we reviewed cited references and conducted a Web of Science citation search seeking additional reports meeting inclusion criteria. If multiple studies provided data on the same base population, we included only information from the most recent report. All contributing studies were cohort studies. Information extraction is described in Supplementary Material.

5. Outcome Definitions

All-cause mortality, also called overall survival, was defined as time from bladder cancer diagnosis to death from any cause. Bladder cancer-specific mortality, also called bladder cancer-specific survival, was defined as time from cancer diagnosis until death from bladder cancer, with death due to alternate causes censored. Recurrence was defined as time elapsed between initiation of curative treatment and documented recurrence, with death from any cause before recurrence being censored. Recurrence-free survival (RFS) was similarly defined except death from any cause before recurrence was counted as an event. Progression was defined as time from initial treatment to any increase in grade or stage after repeat treatment for recurrence, with death from any cause censored. Progression-free survival (PFS) was similarly defined except death before progression was counted as an event. In all studies, patients who did not experience the event under investigation were censored at the time of last follow-up. Outcomes were scored according to these definitions using information provided in the methods section of each report. If the original authors did not fully describe the outcome, the stated outcome was assumed to be defined as indicated above. We recognized that if diabetes were associated with mortality during followup, then censoring death would introduce negative bias into studies of recurrence and progression. For completeness we nonetheless summarized data on all 5 outcomes. Finding clear evidence of greater mortality among diabetic patients, we base our inferences on only results for mortality, RFS and PFS.

6. Risk of Bias in Individual Studies

We critically reviewed methodology used in each study for vulnerability to bias, assessing potential for information bias (if methodology allowed significant error in measurement of diabetes or bladder cancer outcomes), participation bias (if nonrepresentative participants were enrolled), and confounding (if bladder cancer risk/protective factors were inadequately controlled).

7. Data Harmonization

We used several procedures to harmonize estimates of diabetes-outcome associations to include in meta-analysis. If estimates were calculated separately for males and females or within categories of race, subgroup-specific estimates were combined using fixed effect meta-analysis [15-17]. If multiple groups of patients with diabetes were compared to the same diabetes-free reference group, dose response methods were used to calculate a diabetic vs non-diabetic estimate using appropriate weights [15,18-20]. If not provided, RRs were calculated from study data when possible [19,21-24]. If a 95% CI was not provided, it was calculated using the p-value [25,26]. Descriptions of these methods appear in Supplementary Material.

8. Synthetic Meta-analysis

We calculated summary estimates of effect size for each outcome reported for 2 or more studies (all-cause mortality, bladder cancer-specific mortality, recurrence, RFS, progression), using random-effects and fixed effect models. We base inferences largely on random-effects analyses because available information provides little basis for assuming a single true effect size for all source populations contributing to each analysis. Heterogeneity was characterized by I2, which represents the proportion of dispersion not explained by random error, corresponding p-value, and tau2, which represents between-study variance. For each synthetic analysis we created a forest plot displaying results of individual contributing studies and summary estimate, and a funnel plot.
We conducted cumulative meta-analyses ordered by publication year (earliest to latest) and examined resulting cumulative forest plots and funnel plots for patterns characteristic of publication bias. We report results of synthetic analyses in graphic and tabular forms.

9. Sensitivity Analyses

We evaluated influence of individual studies by ‘leave one out’ analyses in which synthetic analyses were repeated omitting each study individually and compared resulting summary estimates to the full summary estimate. To evaluate influences of model form used in original analyses we repeated random-effects meta-analyses omitting sets of studies that reported estimates of the risk ratio (RR) or odds ratio (OR) rather than the hazard ratio (HR). To evaluate influence of decisions for redundantly reported data we repeated analyses substituting excluded estimates for included estimates based on the same population.
To investigate influences of potential confounders, we conducted analyses stratified on whether each study controlled potential confounding by age, sex, tumor stage, tumor grade, history of smoking tobacco, and body mass index (BMI), then compared summary estimates from studies that did and did not address each factor. In a further effort to learn whether reported associations were likely to reflect appreciable residual confounding by smoking, we regressed effect size on the score for measure of smoking used in each study, ordered from poorest to best (0, no assessment; 4, assessment of intensity and/or duration).
Due to greater incidence of bladder cancer in males and recognizing that few original studies provided sex-specific estimates enabling synthetic analyses separately for each sex, we conducted study-level analyses, regressing effect size on proportion cases who were female. We implemented these analyses using linear regression weighted by inverse variance of each estimate.
Analyses were implemented using R-Studio (version 4.2.1).

RESULTS

Our searches identified 4868 unique records. After title and abstract screening, 175 full text articles were assessed; 43 met eligibility criteria. Citation searches of the 43 articles identified 3 more (Fig. 1). The 46 articles were reviewed in full. After critical appraisal, data from 28 studies were included in quantitative analyses (Table 1). Of 18 studies excluded during critical appraisal, 3 provided redundant data, 1 used an inappropriate data structure, 1 used enrollment criteria creating extreme vulnerability to bias, and 13 did not report on effect measures of interest (Supplementary Table 1). Included studies investigated over 226,472 bladder cancer patients who were treated with curative intent, among whom over 36,699 were diabetic.

1. All-Cause Mortality

Thirteen studies [16,18,19-24,27-31] provided estimates of the association between diabetes and all-cause mortality. The random-effects summary estimate of this association was 1.22 (95% CI, 1.12-1.33; Fig. 2A). This result was statistically robust: cumulative meta-analysis ordered on study weight revealed that only 2 studies were needed to identify a statistically significant association (Supplementary Fig. 1A), and summary estimate was not materially changed by omitting any individual study (Supplementary Fig. 1B). Between study heterogeneity was moderate but did not achieve statistical significance (I2=34%, p=0.11). Neither the funnel nor the cumulative forest plot ordered on date (Fig. 2B, C) had features characteristic of publication bias. We found no indication that the association arose by confounding: comparable results were obtained in studies that did or did not address each potential confounder (Table 2), and meta-regression on smoking measure identified a nonsignificant and only slightly lower effect size in studies with poorer measures of smoking (Supplementary Fig. 1C). The summary estimate was strongest in 7 studies in which all patients were treated by cystectomy (1.35 [95% CI, 1.20-1.52]) and similarly high in 5 studies that enrolled only patients with MIBC or high-risk NMIBC (1.32 [95% CI, 1.15-1.50]). By comparison, it was 1.00 [95% CI, 0.63-1.58] in 2 studies of NMIBC patients who did not receive cystectomy. Estimates did not differ appreciably in subgroups defined by other patient characteristics or features of study design investigated by sensitivity analysis (Table 3). Sex did not appear to modify effect size; meta-regression on proportion female participants defined a fitted line with slope not significantly different from 0 (p=0.418) (Supplementary Fig. 1D).

2. Bladder Cancer-Specific Mortality

Nine studies [15,17,18,21,24,27,31-33] provided estimates of association between diabetes and bladder cancer-specific mortality. The random-effects summary estimate was 1.28 (95% CI, 1.17-1.41; Fig. 2D), strongest in 5 studies that enrolled only patients with MIBC or high-risk NMIBC (1.48 [95% CI 1.06-2.06]). There was no apparent association in the single study of NMIBC patients who did not receive cystectomy (0.91 [95% CI, 0.29-2.87]). There was appreciable between study heterogeneity (I2=72%, p<0.01) indicating variation between studies is unlikely to be due to chance alone. Funnel and cumulative forest plots (Fig. 2E, F) did not show signs of publication bias. These results were statistically robust (Supplementary Fig. 2A and B) and the summary estimate was not materially changed in any sensitivity analysis (Tables 2, 3). Slopes from meta-regression on smoking measure and proportion female participants did not achieve statistical significance (p=0.952 and p=0.619, respectively) (Supplementary Fig. 2C and D).

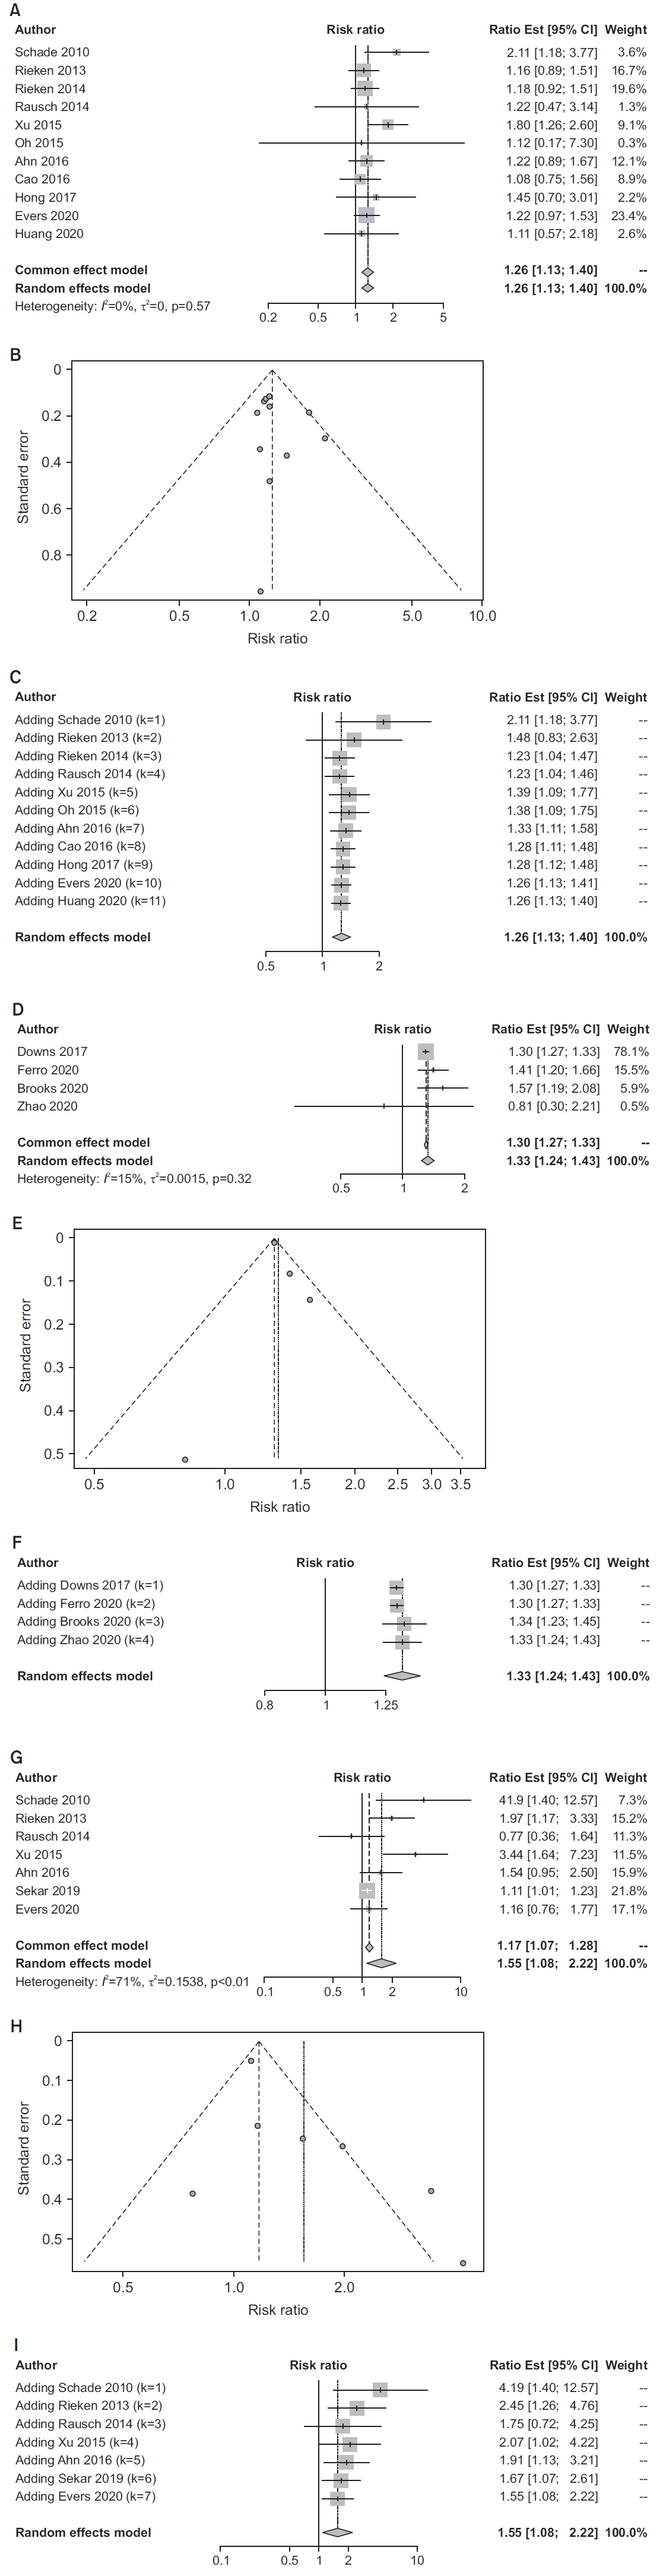
3. Recurrence and RFS

Eleven studies [15,16,20,24,30,31,34-39] provided estimates of the association between history of diabetes and bladder cancer recurrence; 4 [26,31,40,41] provided estimates for RFS. Random-effects summary estimates were 1.26 (95% CI, 1.13-1.40) for recurrence and 1.33 (95% CI 95% CI 1.24-1.43) for RFS (Fig. 3A, D). Because deaths were scored as events in RFS but not in recurrence, the somewhat stronger association of diabetes with RFS accords with results for mortality described above. There was no indication of heterogeneity for either outcome (recurrence: I2=0%, p=0.57; RFS: I2=15%, p=0.32). Funnel and cumulative forest plots (Fig. 3B, C, E-F) did not show signs of publication bias. Summary estimates for recurrence and RFS were statistically robust (Tables 2, 3; Supplementary Figs. 3A-B, 4A-B). Because mortality was associated with diabetes, we regard RFS as the appropriate measure of recurrence. Available data were not adequate for meta-regression of RFS on proportion female participants, but regression on smoking measure revealed a slight slope consistent with negative confounding that did not achieve statistical significance (p=0.136, Supplementary Fig. 4C).

4. Progression and PFS

One study [41] estimated the association between diabetes and PFS, 1.27 (95% CI 0.99-1.63), the more appropriate measure of progression. Seven studies [20,25,34-36,38,42] provided estimates of the association between history of diabetes and bladder cancer progression. The randomeffects summary estimate was 1.55 (95% CI, 1.08-2.22; Fig. 3G). Substantial heterogeneity (I2=71%, p<0.01) indicates that appreciable between study variance may not be due to chance. Funnel and cumulative forest plots (Fig. 3H-I) did not show signs of publication bias. The summary estimate was statistically robust (Supplementary Fig. 5A and B) and largely unchanged in studies that enrolled only bladder cancer patients with urothelial carcinoma. Subgroup analysis that distinguished studies by location resulted in a summary estimate of 2.19 (95% CI, 1.00-4.77) for studies in Asia (n=2), but 1.34 (95% CI, 0.93-1.92) for studies in the US and Europe (n=5); it is noteworthy that studies conducted in Asia enrolled only patients with urothelial carcinoma. The summary estimate for studies of patients with types 1 and 2 diabetes was 1.66 (95% CI, 1.04-2.65), while for studies that included only type 2 diabetics it was 1.19 (95% CI, 0.78-1.79; Table 2). Meta-regression on proportion female defined a slope that did not differ from 0 (p=0.135; Supplementary Fig. 5C).

DISCUSSION

Among bladder cancer patients treated with curative intent, those with diabetes more frequently experienced each of the unfavorable outcomes investigated. Estimates of effect size for all-cause mortality and bladder cancerspecific mortality were comparable, as expected if increased risk of death in diabetics were not due predominately to diabetes-related comorbidities or complications (i.e., cardiovascular disease, wound infections), instead resulting from influence of diabetes on persistence and/or evolution of bladder cancer itself. Consistent with this hypothesis, the meta-analysis identified greater frequency of bladder cancer recurrence and progression in diabetics compared to nondiabetics. Mechanisms by which diabetes may contribute to oncogenesis remain undefined; however, hyperglycemia, hyperinsulinemia, and IGF have all been implicated in cell proliferation and mitogenesis [43]. The plausibility of diabetes-related oncogenesis mediated by these or other mechanisms is supported by separate research identifying elevated cancer-specific mortality in diabetic patients with other cancer types. In a recent review, Shahid et al. [44] reported this finding in diabetic patients with a variety of other cancers. Excess mortality among diabetics is attributed largely to complications of diabetes, predominantly cardiovascular disease [45]. But in a large population-based study of cancer patients by van de Poll-Franse et al. [46], although cardiovascular disease was more prevalent among diabetics than nondiabetics, mortality was greater in those with diabetes after controlling for cardiovascular disease. The relationship of diabetes to recurrence and progression of cancer has been less studied, although diabetics have been shown to have elevated recurrence of colon cancer [47].
Critical appraisal identified several potential sources of systematic error in studies included in our meta-analyses, but these are unlikely to explain elevated mortality amongst diabetic patients. Diabetes care could lead to earlier detection of recurrence or progression in some bladder cancer patients with diabetes. Consequently, differential misclassification could account for some of the positive association between diabetes and some outcomes, but could not create associations with mortality outcomes, because being followed more closely does not make death more apparent. The first sign of bladder cancer is often hematuria detected on a routine urinalysis [48], and diabetics may undergo more frequent urinalysis to screen for glucose or ketones [49] leading to earlier diagnosis of bladder cancer, resulting in lead-time-bias creating spurious impressions of better outcomes in diabetic patients. This would attenuate rather than create the positive associations reported here. Prior studies document that cancer patients with diabetes were treated less aggressively than those without diabetes [46], and specific treatments may be avoided in diabetic patients with MIBC [50]. If some patients with severe or uncontrolled diabetes were not treated surgically for their bladder cancer, they would be underrepresented in studies of patients who underwent radical cystectomy. Such exclusions would introduce downward bias if severe diabetes influences course of bladder cancer more strongly than milder forms, and introduce no bias otherwise. Thus, although these forms of systematic error cannot be ruled out, their presence would not create spurious positive associations between diabetes and mortality, and may have introduced downward bias causing summary results to underestimate true effects.
Studies contributing to the meta-analysis were inconsistent in addressing potentially confounding variables. Older age is associated with mortality, and females have been reported in several studies to have slightly poorer bladder cancer outcomes. In subsets of studies that controlled for each of these factors, summary estimates revealed statistically elevated occurrence of all outcomes among diabetics. Smoking is related to bladder cancer mortality [51] and a risk factor for developing type 2 diabetes [52] and mortality among diabetics [53]. Meta-regression on quality of smoking measure used in each study provided no indication of positive residual confounding that might explain observed associations. Tumor stage and grade are important predictors of bladder cancer outcome, but incidental detection of hematuria in diabetics could result in a distribution of lower stage among diabetics as described above [46,48,49]. To the extent that this occurred, negative confounding could be anticipated in studies that did not address these factors. In subsets of studies that controlled for stage or grade, positive associations approaching or achieving statistical significance were observed in all but one analysis. The exception was an inverse association of diabetes and bladder cancer-specific survival estimated for the small set of studies controlled for grade; this cannot be explained by positive confounding, so may represent random error. Obesity is a risk factor for type 2 diabetes [54]. Obese individuals have been reported to experience elevated bladder cancer recurrence [55], so studies that did not control for obesity could be subject to positive confounding. Sensitivity analyses identified little difference in effect size between studies which did or did not address BMI. These considerations provide reassurance that confounding is unlikely to explain observed associations between diabetes and unfavorable outcomes.
Meta-regression did not identify differences in effect size for males and females, but data required to investigate other potential sources of heterogeneity were not available. For example, previous research revealed inconsistent associations between use of diabetic medications and oncogenesis [56]. Metformin has been associated with decreased cancer risk [57] while other diabetic medications may increase cancer risk [58]. Possible influences of diabetic medications on bladder cancer survival have not been characterized. Thus, differing levels of control for use of antidiabetic medications could explain some of the heterogeneity observed. Other possible sources of heterogeneity include differences in methods of classifying diabetes, different proportions of type 1 and type 2 disease among diabetic participants, differing degrees of glycemic control among diabetic participants, and differing follow-up periods.

CONCLUSION

In summary, we report a systematic review and quantitative summary of published data identifying a clear pattern of poorer outcomes of bladder cancer in patients with diabetes. Despite limitations of studies included in the meta-analysis, bias is unlikely to explain these results. Our study therefore implicates features of diabetes such as hyperinsulinemia and hyperglycemia in an unfavorable course of bladder cancer and identifies diabetes care as a possible component of personalized management of bladder cancer. Further investigation is warranted to pursue these possibilities and to rectify the dearth of scholarly information on diabetes in relation to clinical course of bladder cancer. New research should be implemented with careful control of potential confounders, and with detailed consideration and reporting of types and severity of diabetes, diabetes treatment during cancer care, elements of bladder cancer treatment, whether bladder cancer diagnosis was incidental to diabetes care, and whether patients with severe diabetes are advised to forego elements of usual bladder cancer care at participating institutions. Meanwhile, although mechanisms by which diabetes may lead to worse outcomes for patients with bladder cancer are not established, these results support a multidisciplinary approach to the management of bladder cancer in patients with diabetes in which endocrinologists and urologists coordinate care to improve outcomes [44,46].

Supplementary Materials

Supplementary Material, Table 1 and Figs. 1-5 can be found via https://doi.org/10.22465/juo.244600020001.
Supplementary Table 1.
Studies excluded from quantitative analysis with reasons for exclusion
juo-244600020001-Supplementary-Table-1.pdf
Supplementary Fig. 1.
Results of sensitivity analyses of the association between history of diabetes mellitus and all-cause mortality. (A) Cumulative meta-analysis by weight (smallest first). (B) Leave one out meta-analysis. (C) Meta-regression of all-cause mortality effect estimate and level of smoking control where 0=no control, 1=yes/no, 2=ever/never, 3=current/former/never. (D) Meta-regression of all-cause mortality effect estimate and % female.
juo-244600020001-Supplementary-Fig-1.pdf
Supplementary Fig. 2.
Results of sensitivity analyses of the association between history of diabetes mellitus and bladder cancer specific mortality. (A) Cumulative meta-analysis by weight (smallest first). (B) Leave one out meta-analysis. (C) Meta-regression of bladder cancer specific mortality effect estimate and level of smoking control where 0=no control, 1=yes/no, 2=ever/never, 3=current/former/never. (D) Meta-regression of bladder cancer specific mortality effect estimate and % female.
juo-244600020001-Supplementary-Fig-2.pdf
Supplementary Fig. 3.
Results of sensitivity analyses of the association between history of diabetes mellitus and bladder cancer recurrence. (A) Cumulative meta-analysis by weight (smallest first). (B) Leave one out meta-analysis.
juo-244600020001-Supplementary-Fig-3.pdf
Supplementary Fig. 4.
Results of sensitivity analyses of the association between history of diabetes mellitus and bladder cancer recurrence-free survival. (A) Cumulative meta-analysis by weight (smallest first). (B) Leave one out meta-analysis. (C) Meta-regression of recurrence-free survival effect estimate and level of smoking control where 0=no control, 1=yes/no, 2=ever/never, 3=current/former/never.
juo-244600020001-Supplementary-Fig-4.pdf
Supplementary Fig. 5.
Results of sensitivity analyses of the association between history of diabetes mellitus and bladder cancer progression. (A) Cumulative meta-analysis by weight (smallest first). (B) Leave one out meta-analysis. (C) Meta-regression of progression effect estimate and % female.
juo-244600020001-Supplementary-Fig-5.pdf

NOTES

Funding/Support

This study received no specific grant from any funding agency in the public, commercial, or not-for-profit sectors.

Conflicts of Interest

The authors have nothing to disclose.

Author Contribution

Conceptualization: SF, VC, PZ, LK, RJ, SP, SD; Data curation: SF, VC, PZ, LK, RJ; Formal analysis: KS, RM, SF, VC; Methodology: SF, VC, PZ, RM, KS; Project administration: SF, KS, VC; Visualization: SF, RM, KS, VC; Writing - original draft: SF, VC, PZ; Writing - review & editing: SF, PZ, RM, SP, SD, KS, VC

Fig. 1.
PRISMA (Preferred Reporting Items for Systematic Reviews and Meta-Analyses) diagram illustrating flow of data through the systematic review and meta-analyses.
juo-244600020001f1.jpg
Fig. 2.
Results of meta-analyses estimating associations between history of diabetes and mortality outcomes among bladder cancer patients. (A) All-cause mortality, forest plot from synthetic meta-analysis. (B) All-cause mortality, funnel plot. (C) Allcause mortality, forest plot from cumulative meta-analysis by date. (D) Bladder cancerspecific mortality, forest plot from synthetic meta-analysis. (E) Bladder cancer-specific mortality, funnel plot. (F) Bladder cancerspecific mortality, forest plot from cumulative meta-analysis by date. CI, confidence interval.
juo-244600020001f2.jpg
Fig. 3.
Results of meta-analyses estimating associations between history of diabetes and recurrence and progression outcomes among bladder cancer patients. (A) Bladder cancer recurrence, forest plot from synthetic meta-analysis. (B) Bladder cancer recurrence, funnel plot. (C) Bladder cancer recurrence, forest plot from cumulative meta-analysis by date. (D) Bladder cancer recurrence-free survival, forest plot from synthetic meta-analysis. (E) Bladder cancer recurrence-free survival, funnel plot. (F) Bladder cancer recurrence-free survival, forest plot from cumulative meta-analysis by date. (G) Bladder cancer progression, forest plot from synthetic meta-analysis. (H) Bladder cancer progression, funnel plot. (I) Bladder cancer progression, forest plot from cumulative meta-analysis by date.
juo-244600020001f3.jpg
Table 1.
Sources of published data included in quantitative analyses
Year of publication Last name of first author No. of participants
Proportion female Tumor stages included
Initial treatment received Percent urothelial carcinoma Addressed age as covariate? (Y/N) Addressed sex as covariate? (Y/N) Addressed stage as covariate? (Y/N) Addressed grade as covariate? (Y/N) Addressed smoking as covariate? (Y/N) Addressed BMI/obesity as covariate? (Y/N) Point and (95% CI) of HR, RRa), or ORb) estimate of association between diabetes and outcome of bladder cancer
#with DM #without DM NMIBC:T0, Ta, Tis, T1/MIBC:T2, T3, T4 All-cause mortality Bladder cancerspecific mortality Recurrence-free survival or recurrencec) Progression-free survival or progressiond)
2010 Schade [34]e) 179 Induction BCG N N Y Y N N 2.112c) (1.183-3.773) 4.19d) (1.397-12.566)
2012 Liu [32] 849 47,840 Y Y N N Y Y 1.33 (1.18-1.49)
2012 Currie [28] 675 5,968 Y Y N N Y N 1.16 (1.02-1.32)
2012 Karlin [29] 68 831 0.2 Y Y N N N N 0.91 (0.63-1.32)
2013 Rieken [20] 125 992 0.235 Ta, Tis, T1 TUR Y N Y Y N N 1.245g) (0.905-1.712) 1.159c,g) (0.887-1.514) 1.974d,g) (1.171-3.329)
2014 Rieken [18] 200 1,302 0.216 T0, Ta, Tis, T1, T2, T3, T4 RC 100 Y Y Y Y Y Y 1.347g) (1.063-1.707) 1.364g) (1.039-1.790) 1.178c,g) (0.920-1.507)
2014 Ranc [15] Y Y N N N N 1.258g) (1.195-1.341)
2014 Rausch [25] 52 140 0.17 Ta, T1 N N N N N N 1.2212c) (0.474-3.1434) 0.7729d) (0.364-1.6435)
2015 Xu [35] 64 339 0.26 Ta, T1 TUR 100 N N N N N N 1.805c) (1.255-2.596) 3.439d) (1.636-7.229)
2015 Zhang [30] 25 99 0.19 T1, T2, T3, T4 RC 100 Y Y Y Y Y Y 1.678 (0.918-2.029)
2015 Oh [21] 28 172 0.12 Ta, Tis, T1, T2, T3, T4 RC 100 N N Y N N N 1.281 (1.052-1.468) 1.785 (1.252-2.295) 1.117c,g) (0.171-7.312)
2015 Dybowski [22] 10 53 0.27 T0, T1, T2, T3, T4 RC 100 N N N N N N 1.403a,g) (0.893-2.204)
2016 Wang [33] 12 91 0.2427 T1, T2, T3, T4 RC 100 N Y Y Y N N 0.104 (0.014-0.786)
2016 Faiena [19] 16,682 73,603 0.16 RC Y Y N N N N 2.569b,g) (0.972-6.79)
2016 Ahn [36] 127 518 0.15 Ta, T1 TUR Y Y Y Y Y N 1.22c) (0.89-1.67) 1.54d) (0.95-2.50)
2016 Cao [37] 72 170 0.264 Ta, T1 TUR 100 N N N N N N 1.08c) (0.75-1.56)
2017 Kwiatkowska [23] 8 36 0.43 RC N N N N N N 1.929a,g) (0.344-10.808)
2017 Strele [16] 169 1,658 0.23 Y N N N N N 1.252g) (0.941-1.667)
2017 Downs [26]e) 120 184 TUR N N N N N N 1.3 (1.27-1.33)
2018 Hong [27] 21 72 0.3 T2 TUR (n=27) 100 N N N N Y N 2.74 (1.09-6.83) 3.32 (1.28-8.69) 1.45c) (0.70-3.01)
RC (n=66)
2018 Lam [17] 14,199 46,182 0.267 Y Y Y N N N 1.162g) (1.134-1.192)
2019 Sekar [42]e) 3,563 5,211 Y Y Y N N N 1.21f) (1.01-1.45) 1.113d,g) (1.008-1.229)
2020 Brooks [40] 104 471 0.2 Ta, Tis, T1 Induction BCG 96 N Y Y Y Y Y 1.57 (1.2-2.1)
2020 Evers [38] 198 1,235 0.172 Ta, Tis, T1 99.4 Y Y Y Y Y Y 1.22c) (0.98-1.54) 1.16d) (0.76-1.76)
2020 Ferro [41] 231 941 0.169 T1 Induction BCG Y Y Y Y Y Y 1.41 (1.20-1.66) 1.27 (0.99-1.63)
2020 Huang [39] 61 226 T1 , Tis TUR 100 Y Y Y Y Y Y 1.11c) (0.57-2.19)
2020 Wang [24] 22 100 0.172 Ta, Tis, T1 Induction BCG 100 Y N Y Y N N 0.779a,g) (0.536-1.132) 0.909a,g) (0.288-2.872)
2020 Zhao [31] 14 160 0.2 RC 100 N N N N N N 1.00 (0.43-2.30) 0.92 (0.37-2.29) 0.81 (0.30-2.24)

DM, diabetes mellitus; NMIBC, non-muscle-invasive bladder cancer; MIBC, muscle-invasive bladder cancer; BMI, body mass index; CI, confidence interval; HR, hazard ratio; RR, risk ratio; OR, odds ratio; BCG, bacillus Calmette-Guerin; TUR, transurethral resection; RC, radical cystectomy.

a) RR.

b) OR.

c) Recurrence.

d) Progression.

e) Information provided only in abstract form, not full text report.

f) Bladder cancer-specific mortality results reported in this abstract excluded from quantitative analysis to avoid redundant use of information provided in full report of Lam 2018.

g) Estimates calculated from information provided in report as described in supplementary methods.

Blank cells indicate that information was not provided in the original report.

Table 2.
Summary estimates of association between diabetes and each of 4 bladder cancer outcomes, in full set of contributing studies and subgroups defined by the features of the original studies
Set of studies Summary estimate (95% CI) No. of studies Heterogeneity parameters
I2 p-value Tau2
All-cause mortality
 All contributing studies [16,18,19-24,27-31] 1.22 (1.12-1.33) 13 34 0.11 0.0014
 Studies located in US and Europe only [18,19,20,22,23,28,29] 1.21 (1.10,1.33) 8 0 0.48 0.0000
 Studies located in Asia only [21,24,27,30,31] 1.27 (0.89-1.81) 5 65 0.02 0.0991
 Studies which reported time to event data (HR) [16,18,19,20,21,27-31] 1.23 (1.14-1.34) 9 17 0.29 <0.0001
 Studies limited to urothelial cell carcinoma [18,21,24,27,30,31] 1.28 (0.99-1.64) 6 57 0.04 0.0529
 Studies restricted to type 2 DM [21,28] 1.20 (1.09-1.33) 2 0 0.36 0.0000
 Studies which did not differentiate between types 1 and 2 DM [16,18-20,22,23,24,27,29-31] 1.25 (1.06-1.49) 11 42 0.07 0.0307
 Studies limited to subjects who underwent radical cystectomy [18,19,21,22,23,30,31] 1.35 (1.20-1.52) 7 0 0.69 0.0000
 Studies limited to subjects who did not undergo radical cystectomy [20,24] 1.00 (0.63-1.58) 2 71 0.06 0.0785
 Studies which did not limit by treatment or did not specify treatment [16,27-29] 1.16 (1.04-1.30) 4 43 0.15 <0.0001
 Studies limited to MIBC and high-risk NMIBC only [18,21,23,27,31] 1.32 (1.15-1.50) 5 0 0.53 0.0000
 Studies limited to NMIBC only [20,24] 1.00 (0.63-1.58) 2 71 0.06 0.0785
Bladder cancer-specific mortality
 All contributing studies [15,17,18,21,24,27,31-33] 1.28 (1.17,1.41) 9 72 <0.01 0.0074
 Studies located in US and Europe only [15,17,18,32] 1.24 (1.15-1.33) 4 73 0.01 0.0032
 Studies located in Asia only [21,24,27,31,33] 1.16 (0.52-2.58) 5 67 0.02 0.5573
 Studies which reported time to event data (HR) [15,17,18,21,27,31,32,33] 1.29 (1.17,1.42) 8 76 <0.01 0.0079
 Studies limited to urothelial cell carcinoma [18,21,24,27,31,33] 1.43 (0.90-2.07) 6 61 0.02 0.0489
 Studies restricted to type 2 DM [21,32] 1.49 (1.12-1.97) 2 68 0.08 0.0296
 Studies which did not differentiate between types 1 and 2 DM [15,17,18,24,27,31,33] 1.21 (1.13-1.31) 7 66 <0.01 0.0026
 Studies limited to subjects who underwent radical cystectomy [18,21,31,33]a) 1.29 (0.84,1.97) 4 69 0.02 0.0942
 Studies limited to subjects who did not undergo radical cystectomy [24] 0.91 (0.29-2.87) 1 - - -
 Studies which did not limit subjects by treatment or did not specify treatment [15,17,27,32] 1.24 (1.15-1.34) 4 80 <0.01 0.0037
 Studies limited to MIBC and high-risk NMIBC only [18,21,27,31,33] 1.48 (1.06,2.06) 5 67 0.02 0.0538
 Studies limited to NMIBC only [24] 0.91 (0.29,2.87) 1 NA NA NA
Recurrence-free survival (death counted as an event)b)
 All contributing studies [26,31,40,41] 1.33 (1.24-1.43) 4 15 0.32 0.0015
 Studies located in US and Europe only [26,40,41] 1.34 (1.23-1.45) 2 25 0.27 0.0022
 Studies located in Asia only [31] 0.81 (0.30-2.21) 1 NA NA NA
Progression-free survival (death counted as an event)b)
 All contributing studies [41] 1.27 (0.99-1.63) 1 NA NA NA
Recurrence (death was censored)c)
 All contributing studies [18,20,21,25,27,34-39] 1.26 (1.13-1.40) 11 0 0.57 0.0000
 Studies located in US and Europe Only [18,20,25,34,38] 1.23 (1.07-1.41) 5 0 0.46 0.0000
 Studies located in Asia Only [21,27,35-39] 1.31 (1.05-1.64) 6 0 0.47 0.0159
 Studies which reported time to event data (HR) [18,20,27,34-39] 1.26 (1.13-1.40) 9 6 0.38 <0.0001
 Studies limited to urothelial cell carcinoma [18,21,27,35,36,37,39] 1.27 (1.08-1.49) 7 0 0.54 0.0042
 Studies restricted to type 2 DM [21,36,38] 1.09 (0.89-1.35) 3d) 0 0.66 0.0000
 Studies which did not differentiate between types 1 and 2 DM [18,20,25,27,34,35,37,38,39] 1.30 (1.11-1.53) 9d) 5 0.39 0.0107
 Studies limited to MIBC and high-risk NMIBC only [18,21,27] 1.20 (0.95-1.52) 3 0 0.87 0.0000
 Studies limited to NMIBC only [20,25,34-39] 1.28 (1.12-1.47) 8 14 0.32 0.0054
Progression (death was censored)c)
 All contributing studies [20,25,34-36,38,42] 1.55 (1.08-2.22) 7 71 <0.01 0.1538
 Studies located in US and Europe only [20,25,34,38,42] 1.34 (0.93-1.92) 5 63 0.03 0.0976
 Studies located in Asia only [35,36] 2.19 (1.00-4.77) 2 68 0.08 0.2204
 Studies which reported time to event data (HR) [20,34-36,38,42] 1.66 (1.15-2.47) 6 74 <0.01 0.1487
 Studies limited to Urothelial Cell Carcinoma [25,35,36] 1.60 (0.72-3.55) 3 74 0.02 0.381
 Studies restricted to type 2 DM [36,38] 1.19 (0.78-1.79) 2d) 56 0.13 0.0521
 Studies which did not differentiate between types 1 and 2 DM [20,24,34,35,38,42] 1.66 (1.04-2.65) 6d) 74 <0.01 0.2289

CI, confidence interval; US, United States of America; DM, diabetes mellitus; MIBC, muscle-invasive bladder cancer; NMIBC, non-muscle-invasive bladder cancer; HR, hazard ratio; NA, not applicable.

a) Fixed effect estimate reported to address extreme differences in study weights.

b) Results presented in the body of the paper and basis of inferences.

c) Results provided for completeness.

d) Evers 2020 reported both overall diabetes and type 2 diabetes only estimates and was included in both subgroups.

Table 3.
Summary estimates of association between diabetes and each of 4 bladder cancer outcomes by subgroups defined by whether or not study addressed the covariate of interest
Covariate Addressed
Did not address
Summary estimate (95% CI) No. of studies Heterogeneity parameters
I2 p-value Tau2 I2 p-value Tau2
All-cause mortality
 Age 1.20 (1.04-1.37) 8 [16,18,19,20,24,28-30] 49 0.06 0.0143 1.31 (1.13-1.53) 5 [21,22,23,27,31] 0 0.00 0.5200
 Sex 1.26 (1.04-1.52) 5 [18,19,28,29,30] 52 0.02 0.0800 1.22 (1.07-1.40) 8 [16,20-24,27,31] 28 0.20 0.0049
 Stage 1.24 (1.03-1.50) 5 [18,20,21,24,30] 54 0.07 0.0246 1.19 (1.07-1.32) 8 [16,19,22,23,27,28,29,31] 21 0.26 0.0000
 Gradea) 1.22 (0.91-1.63) 4 [18,20,24,30] 65 0.03 0.0590 1.21 (1.11-1.33) 9 [16,19,21-23,27,28,29,31] 15 0.31 0.0000
 Smokingb) 1.36 (1.10-1.68) 4 [18,27,28,30] 55 0.09 0.0214 1.17 (1.01-1.36) 9 [16,19,20-24,29,31] 29 0.19 0.0123
 BMI 1.43 (1.16-1.75) 2 [18,30] 0 0.35 0.0000 1.19 (1.09-1.29) 11 [16,19,20-24,27,28,29,31] 32 0.15 <0.0001
Bladder cancer-specific mortality
 Age 1.24 (1.15-1.33) 5 [15,17,18,24,32] 65 0.02 0.0031 1.12 (0.36-3.49) 4 [21,27,31,33] 73 0.01 1.0581
 Sex 1.23 (1.15-1.33) 5 [15,17,18,32,33] 76 <0.01 0.0031 1.63 (1.07-2.48) 4 [21,24,27,31] 38 0.18 0.0593
 Stage 1.30 (1.02-1.65) 5 [17,18,21,24,33] 73 <0.01 0.0354 1.27 (1.21-1.34) 4 [15,27,31,32] 40 0.17 <0.0001
 Gradea) 0.69 (0.19-2.44) 3 [18,24,33] 69 0.04 0.9049 1.30 (1.15-1.47) 6 [15,17,21,27,31,32] 77 <0.01 0.0119
 Smokingb) 1.35 (1.21-1.50) 3 [18,27,32] 42 0.18 <0.0001 1.25 (1.05-1.49) 6 [15,17,21,24,31,33] 74 <0.01 0.02
 BMI 1.34 (1.20-1.49) 2 [18,32] 0 0.87 0.0000 1.30 (1.06-1.59) 7 [15,17,21,24,27,31,33] 75 <0.01 0.0315
Recurrence-free survival
 Age 1.41 (1.20-1.66) 1 [41] - - - 1.33 (1.18-1.49) 3 [26,31,40] 23 0.27 0.0039
 Sex 1.45 (1.26-1.67) 2 [40,41] 0 0.51 0 1.30 (1.27-1.33) 2 [26,31] 0 0.36 0
 Stage 1.45 (1.26-1.67) 2 [40,41] 0 0.51 0 1.30 (1.27-1.33) 2 [26,31] 0 0.36 0
 Gradea) 1.45 (1.26-1.67) 2 [40,41] 0 0.51 0 1.30 (1.27-1.33) 2 [26,31] 0 0.36 0
 Smokingb) 1.45 (1.26-1.67) 2 [40,41] 0 0.51 0 1.30 (1.27-1.33) 2 [26,31] 0 0.36 0
 BMI 1.45 (1.26-1.67) 2 [40,41] 0 0.51 0 1.30 (1.27-1.33) 2 [26,31] 0 0.36 0
Recurrence
 Age 1.19 (1.05-1.35) 5 [18,20,36,38,39] 0 1.00 0.0000 1.48 (1.11-1.98) 6 [21,25,27,34,35,37] 12 0.34 0.0372
 Sex 1.20 (1.04-1.39) 4 [18,36,38,39] 0 0.99 0.0000 1.38 (1.09-1.75) 7 [20,21,25,27,34,35,37] 20 0.27 0.0319
 Stage 1.22 (1.08-1.38) 7 [18,20,21,34,36,38,39] 0 0.71 0.0000 1.39 (1.00-1.91) 4 [25,27,35,37] 23 0.27 0.0378
 Gradea) 1.22 (1.08-1.38) 6 [18,20,34,36,38,39] 0 0.59 <0.0001 1.38 (1.01-1.89) 5 [12,25,27,35,37] 0 0.41 0.0352
 Smokingb) 1.21 (1.05-1.39) 5 [18,27,36,38,39] 0 0.99 0.0000 1.38 (1.06-1.80) 6 [20,21,25,34,35,37] 33 0.19 0.0408
 BMI 1.20 (1.02-1.41) 3 [18,38,39] 0 0.96 0.0000 1.34 (1.11-1.61) 8 [20,21,25,27,34-37] 10 0.35 0.0170
Progression
 Age 1.30 (1.01-1.66) 4 [20,36,38,42] 49 0.12 0.0307 2.15 (0.74-6.25) 3 [25,34,35] 80 <0.01 0.6894
 Sex 1.13 (1.03-1.24) 3 [36,38,42] 0 0.43 0.0000 2.07 (1.02-4.22) 4 [20,25,34,35] 70 0.02 0.3706
 Stage 1.44 (1.06-1.95) 5 [20,34,36,38,42] 64 0.02 0.0657 1.63 (0.38-7.05) 2 [25,35] 87 <0.01 0.9683
 Gradea) 1.66 (1.14-2.36) 4 [20,34,36,38] 48 0.12 0.0541 1.40 (0.62-3.16) 3 [25,35,42] 79 <0.01 0.4258
 Smokingb) 1.31 (0.95-1.80) 2 [36,38] 0 0.39 0.0000 1.75 (0.98-3.12) 5 [20,25,34,35,42] 79 <0.01 0.3209
 BMI 1.16 (0.76-1.77) 1 [38] - - - 1.67 (1.07-2.61) 6 [20,25,34,35,36,42] 76 <0.01 0.2097

CI, confidence interval; BMI, body mass index.

a) Fixed effect estimate reported to address extreme differences in study weights.

b) Studies which controlled for smoking did so at the level of yes/no, ever/never, current/former/never, measures of intensity and/or duration, or using a proxy measure (i.e., chronic obstructive pulmonary disease).

REFERENCES

1. Saginala K, Barsouk A, Aluru JS, Rawla P, Padala SA, Barsouk A. Epidemiology of bladder cancer. Med Sci (Basel) 2020;8:15.
crossref pmid pmc
2. American Cancer Society. Key statistics for bladder cancer [Internet]. Atlanta (GA): American Cancer Society; 2019 [cited 2022 Mar 19]. Available from: https://www.cancer.org/cancer/bladder-cancer/about/key-statistics.html.
3. National Cancer Institute, Surveillance, Epidemiology, and End Results (SEER) Program. Cancer stat facts: bladder cancer [Internet]. Bethesda (MD): National Cancer Institute; [cited 2022 Mar 19]. Available from: https://seer.cancer.gov/statfacts/html/urinb.html.
4. Sylvester RJ, van der Meijden AP, Oosterlinck W, Witjes JA, Bouffioux C, Denis L, et al. Predicting recurrence and progression in individual patients with stage Ta T1 bladder cancer using EORTC risk tables: a combined analysis of 2596 patients from seven EORTC trials. Eur Urol 2006;49:466-5; discussion 475-7.
crossref pmid
5. Richters A, Aben KKH, Kiemeney L. The global burden of urinary bladder cancer: an update. World J Urol 2020;38:1895-904.
crossref pmid pmc pdf
6. United Nations Department of Economic and Social Affairs. World population prospects, the 2017 Revision, Volume I: comprehensive tables. New York: United Nations; 2017.
7. NCD Risk Factor Collaboration (NCD-RisC). Worldwide trends in diabetes since 1980: a pooled analysis of 751 population-based studies with 4.4 million participants. Lancet 2016;387:1513-30.
pmid pmc
8. Chen L, Li H, Gu L, Ma X, Li X, Gao Y, et al. The impact of diabetes mellitus on renal cell carcinoma prognosis: a meta-analysis of cohort studies. Medicine (Baltimore) 2015;94:e1055.
pmid pmc
9. Jiang Y, Ben Q, Shen H, Lu W, Zhang Y, Zhu J. Diabetes mellitus and incidence and mortality of colorectal cancer: a systematic review and meta-analysis of cohort studies. Eur J Epidemiol 2011;26:863-76.
crossref pmid pdf
10. Huang W, Ren H, Ben Q, Cai Q, Zhu W, Li Z. Risk of esophageal cancer in diabetes mellitus: a meta-analysis of observational studies. Cancer Causes Control 2012;23:263-72.
crossref pmid pdf
11. Ren HB, Yu T, Liu C, Li YQ. Diabetes mellitus and increased risk of biliary tract cancer: systematic review and meta-analysis. Cancer Causes Control 2011;22:837-47.
crossref pmid pdf
12. Ling S, Brown K, Miksza JK, Howells LM, Morrison A, Issa E, et al. Risk of cancer incidence and mortality associated with diabetes: a systematic review with trend analysis of 203 cohorts. Nutr Metab Cardiovasc Dis 2021;31:14-22.
crossref pmid
13. Janssen-Heijnen ML, Houterman S, Lemmens VE, Louwman MW, Maas HA, Coebergh JW. Prognostic impact of increasing age and co-morbidity in cancer patients: a populationbased approach. Crit Rev Oncol Hematol 2005;55:231-40.
crossref pmid
14. Page MJ, McKenzie JE, Bossuyt PM, Boutron I, Hoffmann TC, Mulrow CD, et al. The PRISMA 2020 statement: an updated guideline for reporting systematic reviews. BMJ 2021;372:n71.
crossref pmid pmc
15. Ranc K, Jørgensen ME, Friis S, Carstensen B. Mortality after cancer among patients with diabetes mellitus: Effect of diabetes duration and treatment. Diabetologia 2014;57:927-34.
crossref pmid pdf
16. Strele I, Pildava S, Repsa I, Kojalo U, Vilmanis J, Brigis G. Pre-existing diabetes mellitus and all-cause mortality in cancer patients: a register-based study in Latvia. Acta Oncologica 2017;57:973-82.
crossref pmid
17. Lam C, Cronin K, Ballard R, Mariotto A. Differences in cancer survival among white and black cancer patients by presence of diabetes mellitus: estimations based on SEERMedicare-linked data resource. Cancer Med 2018;7:3434-44.
pmid pmc
18. Rieken M, Xylinas E, Kluth L, Crivelli JJ, Chrystal J, Faison T, et al. Effect of diabetes mellitus and metformin use on oncologic outcomes of patients treated with radical cystectomy for urothelial carcinoma. Urol Oncol 2014;32:49.e7-14.
crossref pmid
19. Faiena I, Dombrovskiy VY, Sultan RC, Salmasi AH, Singer EA, Weiss RE. Effect of uncontrolled diabetes on outcomes after cystectomy in patients with bladder cancer: a population-based study. Clin Genitourin Cancer 2016;14:e509-14.
crossref pmid
20. Rieken M, Xylinas E, Kluth L, Crivelli JJ, Chrystal J, Faison T, et al. Association of diabetes mellitus and metformin use with oncological outcomes of patients with non-muscleinvasive bladder cancer. BJU Int 2013;112:1105-12.
crossref pmid
21. Oh JJ, Kang MY, Jo JK, Lee HM, Byun SS, Lee SE, et al. Association between diabetes mellitus and oncological outcomes in bladder cancer patients undergoing radical cystectomy. Int J Urol 2015;22:1112-7.
crossref pmid
22. Dybowski B, Ossoliński K, Ossolińska A, Peller M, Bres-Niewada E, Radziszewski P. Impact of stage and comorbidities on five-year survival after radical cystectomy in Poland: single centre experience. Cent European J Urol 2015;68:278-83.
crossref pmid pmc
23. Kwiatkowska M, Dybowski B, Kuczkiewicz-Siemion O, Osiecki R, Śmigielska K, Gonczar S, et al. Factors affecting one-year survival after radical cystectomy: a prospective study. Cent European J Urol 2017;70:238-44.
pmid pmc
24. Wang Z, Ong WYF, Shen T, Sng JH, Lata RM, Mahendran R, et al. Beyond diabetes mellitus: role of metformin in nonmuscle-invasive bladder cancer. Singapore Med J 2022;63:209-13.
crossref pmid pmc
25. Rausch S, Hennenlotter J, Todenhöfer T, Aufderklamm S, Schwentner C, Sievert KD, et al. Impaired estimated glomerular filtration rate is a significant predictor for non-muscleinvasive bladder cancer recurrence and progression--introducing a novel prognostic model for bladder cancer recurrence. Urol Oncol 2014;32:1178-83.
crossref pmid
26. Downs TM, Rushmer TJ, Abel EJ, Damodaran S, Richards KA, Jarrard DF. Diabetic metrics that lead to increased recurrence rates in non-muscle invasive bladder cancer. J Am Coll Surg 2017;225:e50.
crossref
27. Hong JH, Lin YH, Lu YC, Chiang Y, Tai HC, Huang KH, et al. Comparative analysis between radical cystectomy and trimodality therapy for clinical stage II bladder cancer - experience from a tertiary referral center. Urol Sci 2017;29:25-32.
crossref
28. Currie CJ, Poole CD, Jenkins-Jones S, Gale EA, Johnson JA, Morgan CL. Mortality after incident cancer in people with and without type 2 diabetes: impact of metformin on survival. Diabetes Care 2012;35:299-304.
pmid pmc
29. Karlin NJ, Dueck AC, Cook CB. Cancer with diabetes: prevalence, metabolic control, and survival in an academic oncology practice. Endocr Pract 2012;18:898-905.
crossref pmid
30. Zhang GM, Zhu Y, Luo L, Wan FN, Zhu YP, Sun LJ, et al. Preoperative lymphocyte-monocyte and platelet-lymphocyte ratios as predictors of overall survival in patients with bladder cancer undergoing radical cystectomy. Tumour Biol 2015;36:8537-43.
crossref pmid pdf
31. Zhao M, Liu D, Teng X, Zhong X, Wang Y, Niu H, et al. Prognostic value of albumin-to-alkaline phosphatase ratio before radical cystectomy in patients with bladder cancer. Chi J Urol 2020;41:102-8.
32. Liu X, Ji J, Sundquist K, Sundquist J, Hemminki K. The impact of type 2 diabetes mellitus on cancer-specific survival: a follow-up study in Sweden. Cancer 2012;118:1353-61.
crossref pmid
33. Wang L, Zhou M, Feng C, Gao P, Ding G, Zhou Z, et al. Prognostic value of Ki67 and p63 expressions in bladder cancer patients who underwent radical cystectomy. Int Urol Nephrol 2016;48:495-501.
crossref pmid pdf
34. Schade GR, Parker WR, He C, Beydoun C, Montgomery JS, Lee CT, et al. Diabetes mellitus predicts poor response to induction BCG in non-muscle invasive bladder cancer. J Urol 2010;83:e520.
35. Xu T, Zhu Z, Wang X, Xia L, Zhang X, Zhong S, et al. Impact of body mass on recurrence and progression in Chinese patients with Ta, T1 urothelial bladder cancer. Int Urol Nephrol 2015;47:1135-41.
crossref pmid pdf
36. Ahn JH, Jung SI, Yim SU, Kim SW, Hwang EC, Kwon DD. Impact of glycemic control and metformin use on the recurrence and progression of non-muscle invasive bladder cancer in patients with diabetes mellitus. J Korean Med Sci 2016;31:1464-71.
crossref pmid pmc pdf
37. Cao J, Xu R, Zhao X, Zhong Z, Zhang L, Zhu X, et al. Areca nut chewing and an impaired estimated glomerular filtration rate as significant risk factors for non-muscle-invasive bladder cancer recurrence. Sci Rep 2016;6:29466.
crossref pmid pmc pdf
38. Evers J, Grotenhuis AJ, Aben KK, Kiemeney LA, Vrieling A. No clear associations of adult BMI and diabetes mellitus with non-muscle invasive bladder cancer recurrence and progression. PLoS One 2020;15:e0229384.
crossref pmid pmc
39. Huang WL, Huang KH, Huang CY, Pu YS, Chang HC, Chow PM. Effect of diabetes mellitus and glycemic control on the prognosis of non-muscle invasive bladder cancer: a retrospective study. BMC Urol 2020;20:117.
crossref pmid pmc pdf
40. Brooks NA, Kokorovic A, Xiao L, Matulay JT, Li R, Ranasinghe WKB, et al. The obesity paradox: defining the impact of body mass index and diabetes mellitus for patients with non-muscle-invasive bladder cancer treated with bacillus Calmette-Guérin. BJU Int 2021;128:65-71.
crossref pmid pdf
41. Ferro M, Katalin MO, Buonerba C, Marian R, Cantiello F, Musi G, et al. Type 2 diabetes mellitus predicts worse outcomes in patients with high-grade T1 bladder cancer receiving bacillus Calmette-Guérin after transurethral resection of the bladder tumor. Urol Oncol 2020;38:459-64.
crossref pmid
42. Sekar RR, Brisbane WG, Holt SK, Winters BR, Yu EY, Gore JL, et al. Diabetes severity and metformin are associated with intravesical bacillus calmette-guerin outcomes in non muscle invasive bladder cancer. J Urol 2019;201:e229.
43. Sciacca L, Vigneri R, Tumminia A, Frasca F, Squatrito S, Frittitta L, et al. Clinical and molecular mechanisms favoring cancer initiation and progression in diabetic patients. Nutr Metab Cardiovasc Dis 2013;23:808-15.
crossref pmid
44. Shahid RK, Ahmed S, Le D, Yadav S. Diabetes and cancer: risk, challenges, management and outcomes. Cancers (Basel) 2021;13:5735.
crossref pmid pmc
45. Campbell PT, Newton CC, Patel AV, Jacobs EJ, Gapstur SM. Diabetes and cause-specific mortality in a prospective cohort of one million U.S. adults. Diabetes Care 2012;35:1835-44.
crossref pmid pmc pdf
46. van de Poll-Franse LV, Houterman S, Janssen-Heijnen ML, Dercksen MW, Coebergh JW, Haak HR. Less aggressive treatment and worse overall survival in cancer patients with diabetes: a large population based analysis. Int J Cancer 2007;120:1986-92.
crossref pmid
47. Meyerhardt JA, Catalano PJ, Haller DG, Mayer RJ, Macdonald JS, Benson AB 3rd, et al. Impact of diabetes mellitus on outcomes in patients with colon cancer. J Clin Oncol 2003;21:433-40.
crossref pmid
48. American Cancer Society. Bladder cancer signs and symptoms [Internet]. Atlanta (GA): American Cancer Society; 2019 [cited 2022 Mar 19]. Available from: https://www.cancer.org/cancer/bladder-cancer/detection-diagnosis-staging/signs-and-symptoms.html.
49. Marsden J, Pickering D. Urine testing for diabetic analysis. Community Eye Health 2015;28:77.
pmid pmc
50. Richardson LC, Pollack LA. Therapy insight: influence of type 2 diabetes on the development, treatment and outcomes of cancer. Nat Clin Pract Oncol 2005;2:48-53.
crossref pmid pdf
51. Teoh JY, Huang J, Ko WY, Lok V, Choi P, Ng CF, et al. Global trends of bladder cancer incidence and mortality, and their associations with tobacco use and gross domestic product per capita. Eur Urol 2020;78:893-906.
crossref pmid
52. Maddatu J, Anderson-Baucum E, Evans-Molina C. Smoking and the risk of type 2 diabetes. Transl Res 2017;184:101-7.
crossref pmid pmc
53. Pan A, Wang Y, Talaei M, Hu FB. Relation of smoking with total mortality and cardiovascular events among patients with diabetes mellitus: a meta-analysis and systematic review. Circulation 2015;132:1795-804.
crossref pmid pmc
54. Barnes AS. The epidemic of obesity and diabetes: trends and treatments. Tex Heart Inst J 2011;38:142-4.
pmid pmc
55. Lin Y, Wang Y, Wu Q, Jin H, Ma G, Liu H, et al. Association between obesity and bladder cancer recurrence: a meta-analysis. Clin Chim Acta 2018;480:41-6.
crossref pmid
56. Shlomai G, Neel B, LeRoith D, Gallagher EJ. Type 2 diabetes mellitus and cancer: the role of pharmacotherapy. J Clin Oncol 2016;34:4261-9.
crossref pmid pmc
57. Morales DR, Morris AD. Metformin in cancer treatment and prevention. Annu Rev Med 2015;66:17-29.
crossref pmid
58. Klil-Drori AJ, Azoulay L, Pollak MN. Cancer, obesity, diabetes, and antidiabetic drugs: is the fog clearing? Nat Rev Clin Oncol 2017;14:85-99.
crossref pmid pdf


Editorial Office
Department of Urology, Seoul National University Hospital, Seoul National University College of Medicine,
101 Daehak-ro, Jongno-gu, Seoul 03080, Korea
TEL: +82-2-2072-0817,   FAX: +82-2-742-4665   Email: journal@e-juo.org
Korean Urological Oncology Society
50-1 Yonsei-ro, Seodaemun-gu, Seoul 03722, Korea
Tel: +82-2-704-8574, E-mail: kspe.editor@gmail.com

Copyright © The Korean Urological Oncology Society.

Developed in M2PI